
Linux
Rocky Linux 에서 현재 서버 상태를 보여주는 스크립트 파일 만들기
- 2025.11.11 23:55:40
 현재 서버의 cpu, ram, 네트워크, 저장공간 사용량, 포트별 접속자수를 간략하게 정리하여 화면에 한번에 보여주는 셸 스크립트. sh 작성은 로키리눅스 8.10 에서 진행했다. [!]셸 스크립트 파일 작성[/!] 아래 내용으로 스크립트 파일을 작성한다. # vi ~/1.server_health.sh
파일을 먼저 만든 후 아래 내용을 복사 붙여넣기! #!/usr/bin/env bash
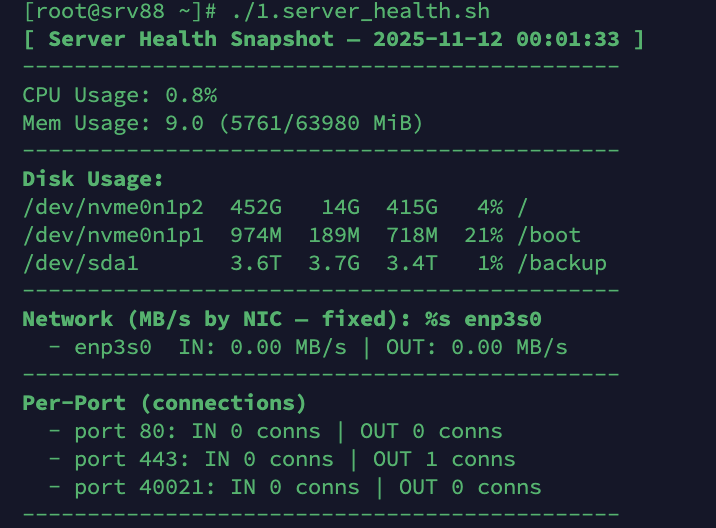
# Rocky Linux 8.x — 웹 느려짐 대응 원샷 점검 스크립트 (최종) # - CPU/메모리 사용률 # - 디스크 사용량 # - NIC별 네트워크 총량 (MB/s) — 기본 enp3s0, IFACE=... 로 변경 가능 # - 포트별 접속자 수 (80, 443, 40021) — ss 기반, nftables 불필요 set -euo pipefail # ===== 설정 ===== IFACE="${IFACE:-enp3s0}" # 기본 NIC 고정(환경변수로 덮어쓰기 가능: IFACE=bond0 ./server_health_final.sh) PORTS=(80 443 40021) # 모니터링 포트 SAMPLE="${SAMPLE:-1}" # 샘플링 간격(초) bold(){ printf "\e[1m%s\e[0m\n" "$*"; } hr(){ printf -- "----------------------------------------------\n"; } # ===== CPU / MEM ===== cpu_sample(){ # /proc/stat 델타로 CPU 사용률 계산 read -r t1 i1 < <(awk '/^cpu /{for(i=2;i<=NF;i++) s+=$i; print s,$5}' /proc/stat) sleep "$SAMPLE" read -r t2 i2 < <(awk '/^cpu /{for(i=2;i<=NF;i++) s+=$i; print s,$5}' /proc/stat) local dt=$((t2 - t1)) di=$((i2 - i1)) awk -v dt="$dt" -v di="$di" 'BEGIN{ if(dt>0) printf "%.1f", (1 - di/dt)*100; else print "0.0" }' } mem_usage(){ # MemAvailable 기준 사용률 awk ' /^MemTotal:/ {t=$2} /^MemAvailable:/ {a=$2} END{ used=t-a; pct=(used/t)*100; printf "%.1f (%d/%d MiB)", pct, used/1024, t/1024 }' /proc/meminfo } # ===== 디스크 ===== disk_usage(){ df -h -x tmpfs -x devtmpfs --output=source,size,used,avail,pcent,target | sed 1d } # ===== 네트워크(지정 NIC만) ===== net_sample_sysfs(){ local nic="$1" local rxp="/sys/class/net/$nic/statistics/rx_bytes" local txp="/sys/class/net/$nic/statistics/tx_bytes" if [[ ! -r "$rxp" || ! -r "$txp" ]]; then printf " - %s 통계 파일 접근 불가 (%s / %s)\n" "$nic" "$rxp" "$txp" return 1 fi local rx1 tx1 rx2 tx2 read -r rx1 <"$rxp" read -r tx1 <"$txp" sleep "$SAMPLE" read -r rx2 <"$rxp" read -r tx2 <"$txp" local dr=$((rx2 - rx1)) dt=$((tx2 - tx1)) awk -v n="$nic" -v dr="$dr" -v dt="$dt" -v s="$SAMPLE" 'BEGIN{ rin=(dr/1048576)/s; rout=(dt/1048576)/s; if(rin<0)rin=0; if(rout<0)rout=0; printf " - %s IN: %.2f MB/s | OUT: %.2f MB/s\n", n, rin, rout }' } # ===== 포트별 접속자 수(ss) ===== per_port_conns(){ # established 기준 inbound/outbound 연결 수 for p in "${PORTS[@]}"; do # inbound: dport=포트로 들어오는 연결 local c_in c_out c_in=$(ss -nt state established "( dport = :$p )" 2>/dev/null | tail -n +2 | wc -l || echo 0) # outbound: sport=포트에서 나가는 연결 c_out=$(ss -nt state established "( sport = :$p )" 2>/dev/null | tail -n +2 | wc -l || echo 0) printf " - port %s: IN %s conns | OUT %s conns\n" "$p" "$c_in" "$c_out" done } # ===== 메인 ===== main(){ bold "[ Server Health Snapshot — $(date '+%F %T') ]" hr printf "CPU Usage: %s%%\n" "$(cpu_sample)" printf "Mem Usage: %s\n" "$(mem_usage)" hr bold "Disk Usage:" disk_usage hr bold "Network (MB/s by NIC — fixed): %s" "$IFACE" net_sample_sysfs "$IFACE" || true hr bold "Per-Port (connections)" per_port_conns hr } main [!]결과 화면[/!] 셸 스크립트를 실행하면 아래와 같이 요약 정보를 보여준다. # ~/1.server_health.sh
 |